Otto — Utility billing, reconciled to the dollar
An end-to-end utility billing platform for multifamily property managers — vendor bill PDF in, branded resident invoice out, every charge auditable.

I designed and built Otto end-to-end — a multi-tenant SaaS that automates the full utility billing cycle for mid-market property managers and third-party billing companies. AI reads the vendor bill, the engine allocates costs across units, and every dollar is traceable in the audit trail. First real customer onboarded; three Founder Partner slots open.
Multifamily utility billing is still run on stitched-together spreadsheets and Conservice-tier portals that haven't shipped a real feature in a decade. Operators paste numbers between vendor PDFs, rent rolls, and Excel; residents get late, opaque invoices; nobody can show their math when a charge is challenged. I wanted one tool for the people running cycles themselves — every month, on real deadlines, with real residents asking real questions — that produced a dollar-reconciled invoice and an audit trail behind every line.
A billing month moves through Otto along one canonical pipeline. Every screen, every API route, every report ladders to one of these seven steps.
- 01Self-funded — every feature had to earn its keep against the next paying customer.
- 02Multi-tenant from day one. Four roles: super admin, company admin, property manager, data entry. RLS at the row level on every table.
- 03Real money flows through Otto Pay. Stripe Connect Standard so funds go direct to the property — Otto never holds money.
- 04Real-world ingest: 18-page omnibus utility bills, scanned PDFs, no two vendors export the same way.
- 05State-by-state compliance — Florida and Texas at launch, Virginia shipping, more behind.
Picked a stack chosen for boring reliability and AI-native ergonomics: Next.js App Router, Supabase (Postgres + Auth + Storage + RLS), Anthropic Claude for OCR, Stripe for billing, Resend for email, Vercel.
Built the calculation engine first — pure functions for RUBS, submetered BTR/BTB, and fixed-fee allocation, audited line by line against real vendor bills before any UI was wired up.
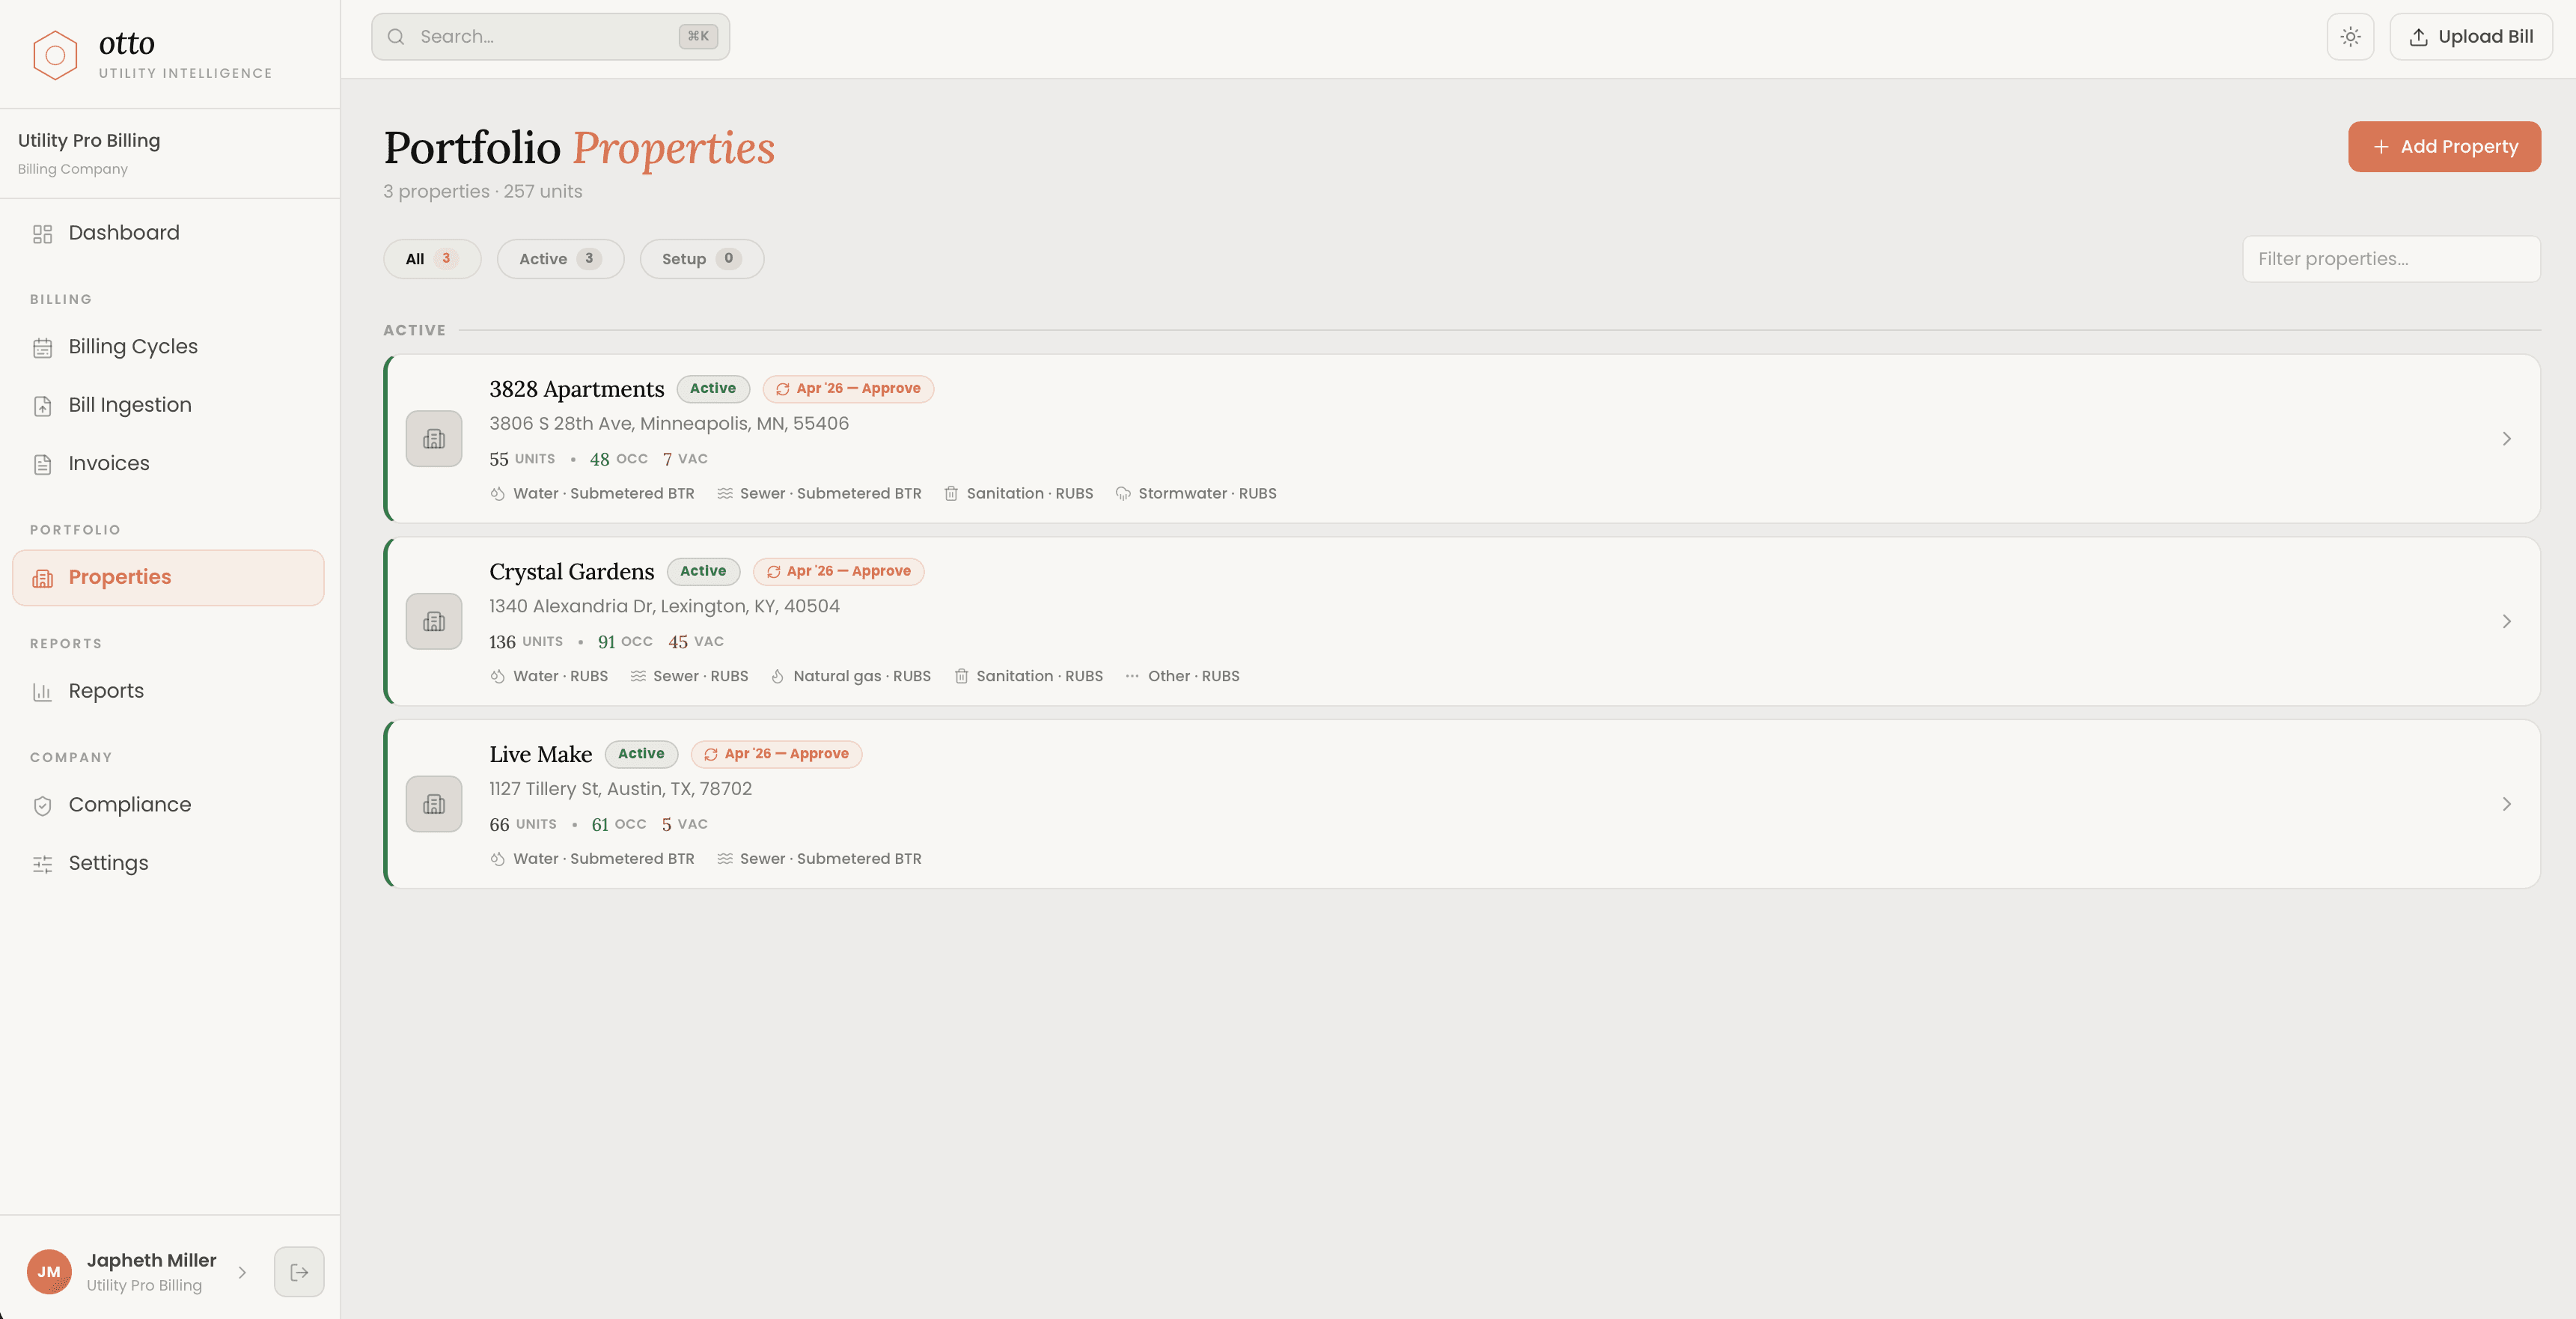
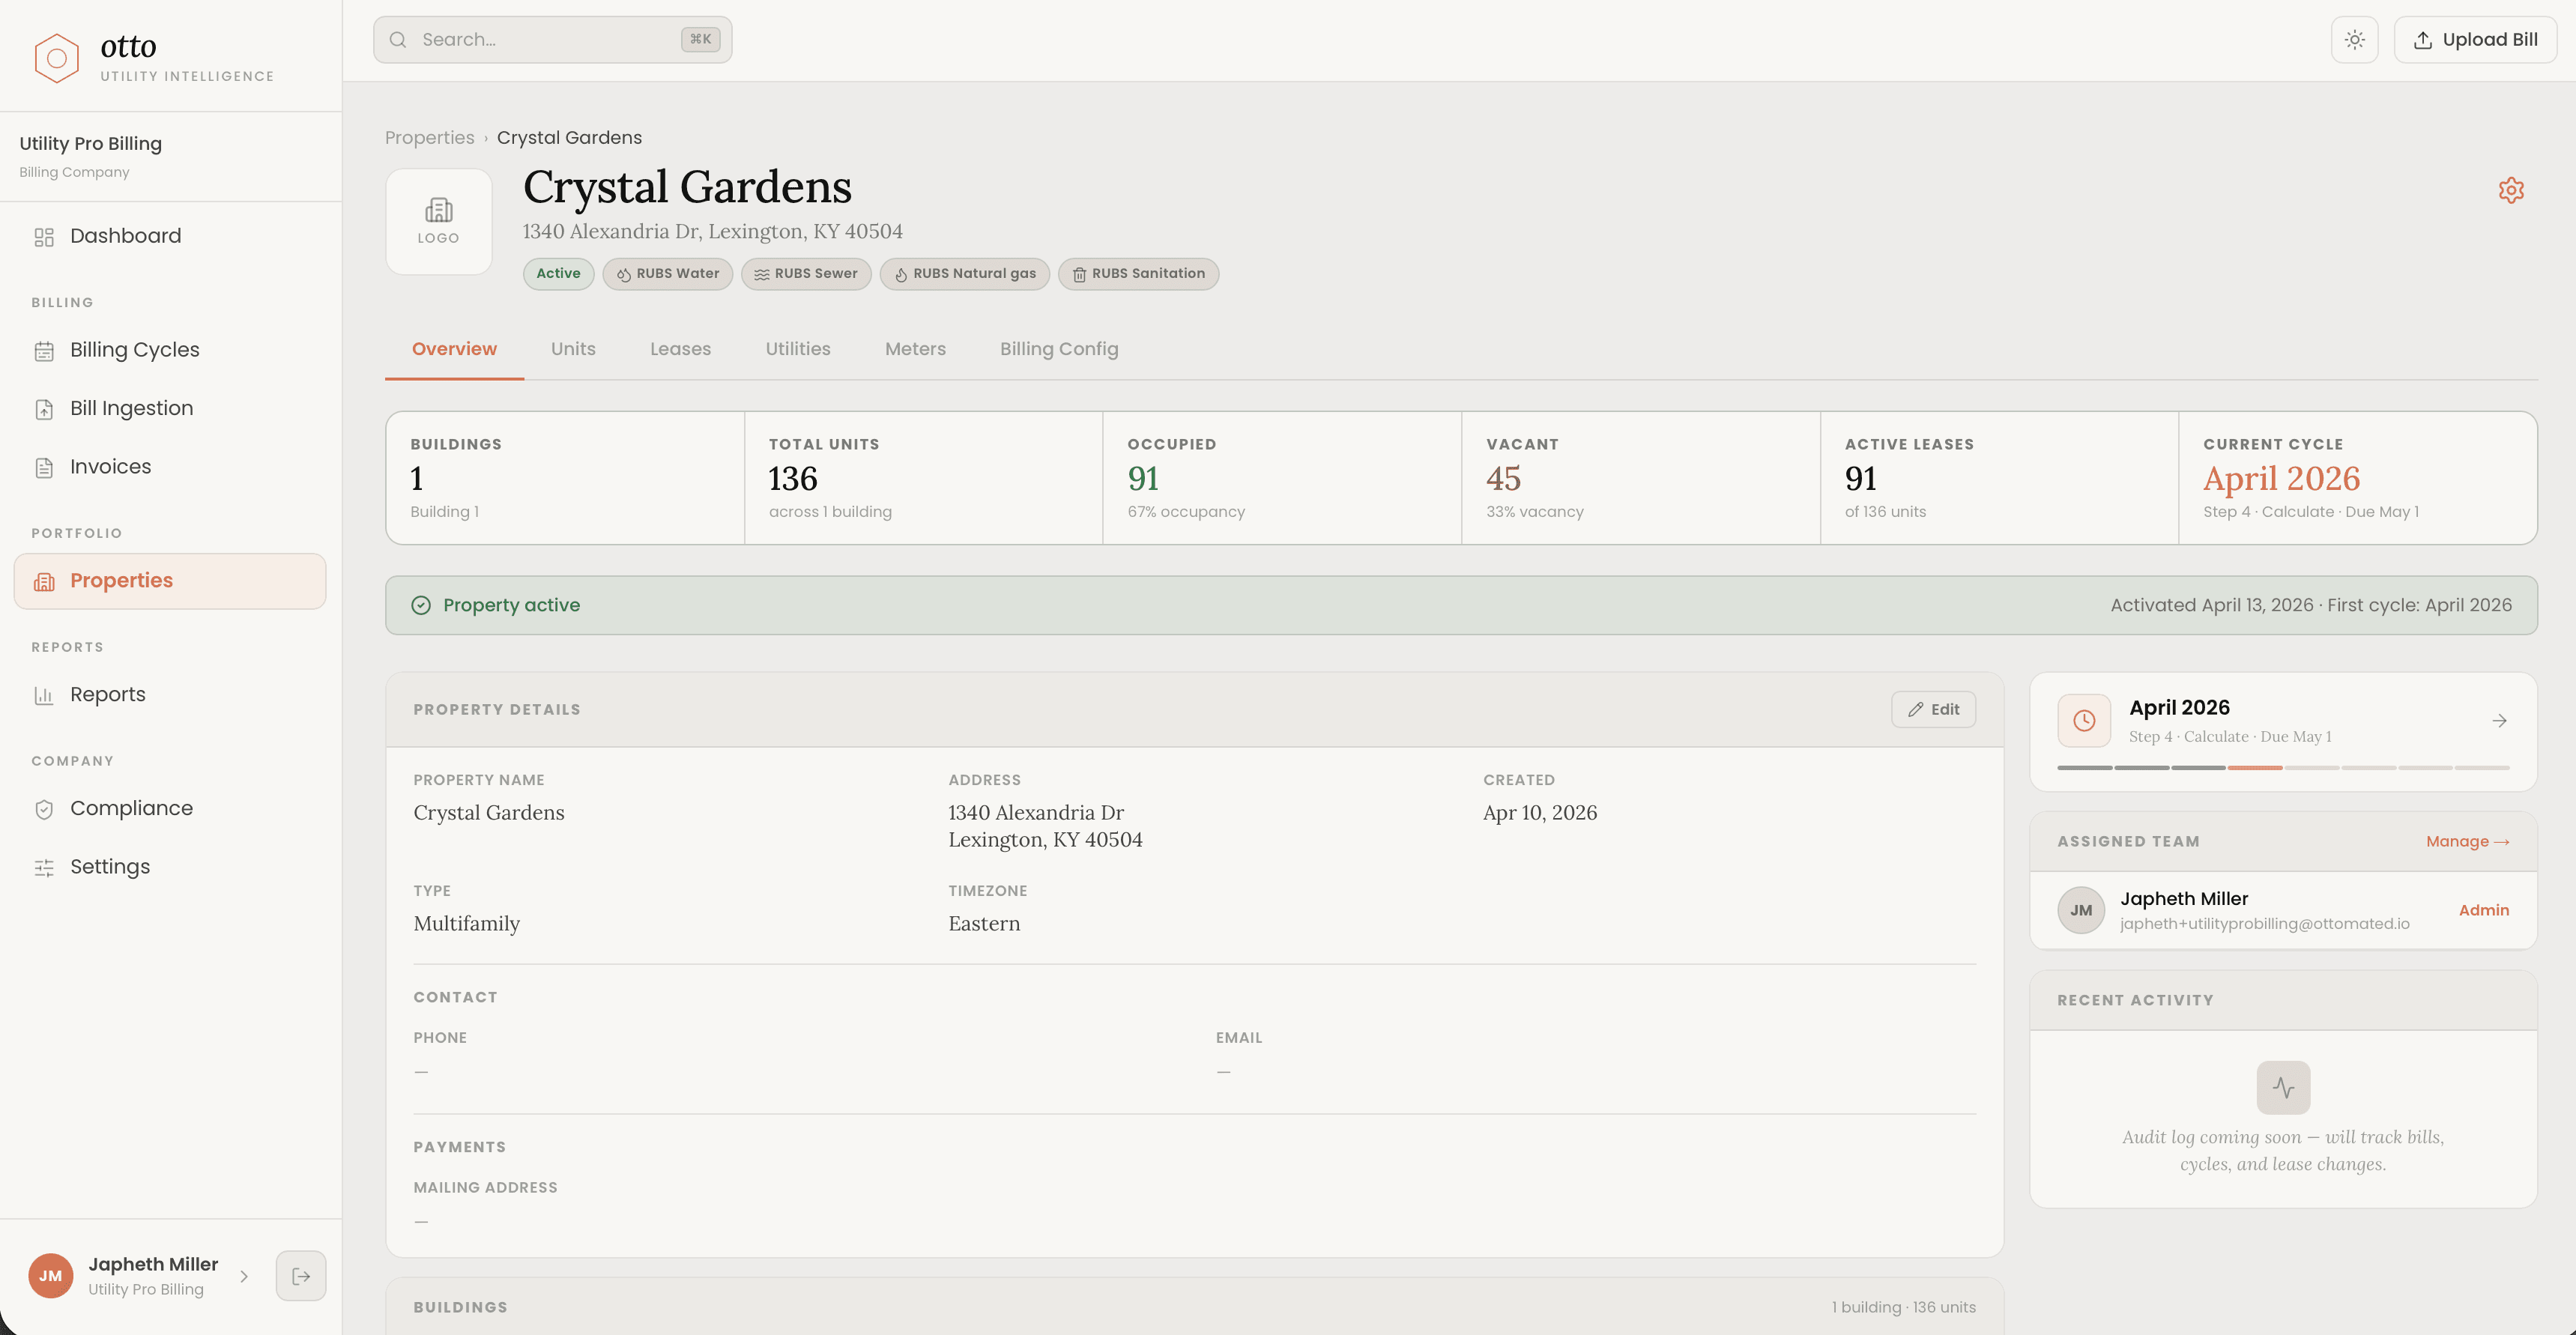
Modeled the entire workflow as one canonical pipeline — Bills → Reads → Rent Roll → Calculate → Approve → Ship → Close — and made every screen a view onto a step in that pipeline.
Designed the system so every charge is derivable. 'Show your math' is the audit trail behind every cycle, every invoice, every dispute.
Shipped Otto Resident (resident portal) and Otto Pay (Stripe Connect payments) as add-ons after the operator platform stabilized. First real paying customer onboarded against the production pipeline.
Seven allocation methods, audited on real data.
The engine is a set of pure functions for vendor-bill-to-resident-charge derivation. Recovery cap, common-area deduction, and proration apply across all methods. Every charge stores its inputs.
Proportional allocation by unit square footage. Vacant share absorbed by the property, not the resident.
Proportional allocation by occupant count, with the same vacant-share rule.
Weighted average of sqft and occupant. Configurable weights per property.
Equal split across all eligible units in the pool.
Bill to Rates — vendor rate × unit reads. Each unit independent of every other.
Bill to Bill — proportional allocation by unit submeter reads against the master meter.
Flat per-unit or per-property charge. Recurring or one-shot final-bill trigger.
Different methods per utility on the same property. Sewer always follows water.
Boring stack on purpose. Every layer chosen so a single developer can keep the whole system in their head.
- FrameworkNext.js (App Router) · TypeScriptOne process for SSR, RSC, and route handlers. No separate API server.
- Database / Auth / StorageSupabase (Postgres + Auth + Storage)RLS at the row level. Auth, storage, and DB share one identity model.
- AI / OCRAnthropic Claude (claude-sonnet-4-6)Vendor-bill OCR and bill-narrative generation. JSON-structured outputs.
- EmailResend + react-email templatesTransactional + invoice delivery. Every send logged to email_log with status.
- PaymentsStripe (subscriptions + Connect Standard)Otto bills the company; Otto Pay funds flow direct to property bank.
- StylingTailwind v4 + design tokens (Ember, Poppins, Lora)All visual decisions live in styles/globals.css. CSS vars only.
- HostingVercel + edge middlewareEdge rewrite for resident.ottomated.io subdomain. ISR for marketing pages.
Properties, units, leases, meters, rent roll, vendor bills — the full operational data model. Role-scoped, RLS-enforced, audit-logged.
Drop a vendor PDF. Claude extracts charges, meter numbers, service addresses, and dates. Multi-page omnibus bills (18-page JEA, City of Houston) handled.
Seven allocation methods — RUBS (sqft / occupant / combo / equal), submetered BTR + BTB, fixed fee. Recovery cap, CAD %, and proration audited on live data.
Bills → Reads → Rent Roll → Calculate → Approve → Ship → Close. Per-cycle review, batch approval, branded invoice PDFs generated and emailed automatically.
Per-property resident portal at resident.ottomated.io/{slug}. Bill history, 'what changed' period comparison, consumption trends, white-label option.
Stripe Connect Standard. ACH + card direct to the property's bank. Five-state payment-CTA gating; Otto never holds funds.
State-aware compliance surface (Virginia first). Portfolio overview, rule-by-utility checklist, sources & updates feed.
Pre-billing report, cycle close report, meter health, recovery trend. Append-only audit log on every mutation, abort-on-failure.
Otto is the platform. Iris is the worker inside it.
Iris drafts work — proposed reads, proposed allocations, proposed resident replies — and humans approve. Every action is logged to the audit trail with the prompt, evidence, and outcome attached.
Trust is earned in stages: v1 manual approve-each, v2 scheduled auto-approve within guardrails, v3 continuous within tighter guardrails. Trigger and trust are orthogonal.
- 01IntentOperator or schedule asks Iris for a piece of work.
- 02EvidenceIris pulls grounded data — bills, reads, lease, prior cycles.
- 03ProposalIris drafts the action with a rationale and a confidence.
- 04GateHuman approves, edits, or rejects. Guardrails enforced server-side.
- 05Execute + AuditOtto applies the action. Audit row is INSERTed before the mutation runs.
Two add-on products sit on top of the operator platform. Both ride the same audit trail and the same charge derivation — the resident sees the same math the operator approved.
Per-property resident portal. Bill history, “what changed” period comparison, consumption trends, branded invoice email.
- ※Email + password resident accounts (PM invite or invoice CTA)
- ※Submeter reads + Otto anomaly detection
- ※Plain-language bill delta vs. prior cycle
- ※White-label toggle (free) — property logo replaces Otto wordmark
- ※90-day post-lease portal access window
ACH + card payments via Stripe Connect Standard. Funds flow direct to the property’s bank account. Otto never holds money.
- ※Stripe Connect Standard — Otto is not a money transmitter
- ※Atomic dual-write (resident_transactions + payment_records) via SECURITY DEFINER RPC
- ※Optimistic settlement — reversal + reconciliation tracked separately
- ※Per-property activation, gated behind Otto Resident
- ※PM-side refund, dispute, and resend-receipt actions
What it did, in numbers.
“I stopped opening five tabs to figure out what my buildings did last week. That's the whole pitch.”— First paying customer · Third-party utility billing company
- ※Build the calculation engine first, audit it on real bills, then wire the UI. The math is the product — every screen above it is window dressing.
- ※Treat 'show your math' as a first-class feature, not an afterthought. The audit trail is the difference between trust and a phone call.
- ※Lock the canonical pipeline early. Every screen, every API route, every report ladders to one of seven steps — the consistency compounds.
- ※AI is for the boring parts (reading a 14-page utility bill) and the human is for the judgment (which lines are billable). Don't reverse them.